










Ocean freight rates for furniture containers have collapsed from their 2021-2022 peaks, yet your landed invoice looks almost identical to what you paid two years ago. Here is the hard truth: shipping is a significant cost driver in furniture imports, but it is not the only one, and it is certainly not the most rigid. At peak, a 40HQ container moving from Shenzhen to Los Angeles might have added $15,000 to your shipment; today, that same slot runs roughly $3,500 to $5,000. Because ocean freight furniture price typically represents roughly 15% to 22% of total landed cost for finished furniture during normal periods—and briefly touched 25% to 30% at the 2022 peak—its decline should, in theory, deliver noticeable relief. Yet that relief is swallowed by persistent raw material inflation, sticky factory pricing psychology, unyielding tariff burdens, and hidden markup resilience across the supply chain. The freight savings exist. They just do not reach you.
The Disconnect: What Buyers Expect vs. What Suppliers Say
You have seen the headlines. The SCFI Shanghai-Los Angeles index is down dramatically. Your logistics contact mentions rates are “back to normal.” Naturally, you reopen negotiations with your Foshan or Dongguan supplier expecting a proportional price cut. Their response? A shrug and a spreadsheet showing “comprehensive cost increases.” You feel gaslit. We have sat in those exact WeChat meetings. The frustration is real, but the supplier is not necessarily lying. They are being selectively transparent.
The linear assumption—freight down, price down—ignores the asymmetry of cost pass-through. When freight spiked in 2021, factories passed every dollar upstream immediately, often with urgency markups. When freight normalized, those same actors discovered that other cost buckets had expanded to fill the gap. Some of that expansion is genuine. Some is margin recapture dressed up as inflation. The psychology is simple: pain travels fast, relief travels slowly.
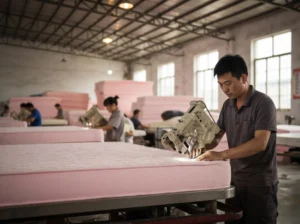
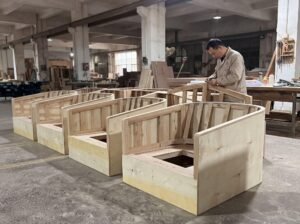
Buyers fixate on the container because it is the most visible, volatile line item. But for a factory in Longjiang, the container is merely the final step. The wood was purchased six months ago. The foam contract was locked in quarterly. The workers were hired at wages set by provincial minimums that only rise. The container rate is an ocean of volatility in a lake of rigidity.
The Real Anatomy of Furniture Landed Cost
Most buyers lack visibility into how a sofa actually accumulates cost from tree to warehouse. Ocean freight furniture price movements grab attention because they are volatile and headline-friendly. The quieter, stickier components are where the real money hides.
| Component | Typical % of Landed Cost | Elasticity | Notes |
|---|---|---|---|
| Raw Materials (solid wood, plywood, foam, fabric, hardware) | 35%–45% | Low | Timber and chemical feedstock prices remain elevated post-2021; foam density upgrades for compliance add hidden BOM inflation |
| Direct Labor & Factory Overhead | 15%–22% | Low | Coastal China manufacturing wages have risen steadily; skilled upholsterers command premium rates due to aging workforce |
| Ocean Freight (40HQ slot, China–US West Coast) | 15%–22% | High | Volatile; peaked near $15,000 in Q3 2022; currently $3,500–$5,000 as of mid-2026 per SCFI trend data |
| Tariffs & Trade Remedies (US 301, AD/CVD on mattresses, wooden bedroom furniture, etc.) | 10%–25% | Zero | Statutory rates; no relief mechanism tied to freight markets; remains a fixed cost anchor |
| Origin Logistics (factory to port, THC, customs brokerage) | 3%–6% | Medium | Fuel and inland trucking rates partially decoupled from ocean rates; driver shortages in Guangdong persist |
| Destination Charges (drayage, customs, warehouse, last-mile) | 4%–8% | Medium | US chassis shortages and warehouse labor inflation persist independently of trans-Pacific rates |
| Importer / Sourcing Agent Margin | 8%–15% | Variable | Often calculated as percentage of CIF or EXW value; markup resilience means the ratio rarely compresses when freight drops |
| Energy & Environmental Compliance | 2%–4% | Low | Post-pandemic environmental inspections in Foshan and Dongguan raised finishing and coating costs; natural gas volatility affects kiln operations |
For reference only, subject to official verification.
Raw materials dominate, but freight is not trivial. A solid wood dining table might carry $180 in timber, $40 in hardware, and $25 in finishing materials before a single worker touches it. Upholstery is even more chemical-dependent. When TDI and polyether polyol prices spiked in 2021, foam suppliers passed that through within thirty days. Those prices never fully retreated. The BOM inflation is permanent.
What the Freight Collapse Actually Means on Your Invoice
Let us put the shipping cost impact under a microscope. A $10,000 drop in container freight is substantial. On a $75,000 FOB furniture load, it is a meaningful shift in the cost mix. But the raw material landscape is not monolithic, and the offsets are messier than your supplier admits.
| Cost Component | 2022 Peak Estimate | 2026 Current Estimate | Change | Impact on Total Landed Cost |
|---|---|---|---|---|
| Ocean Freight (40HQ, China–USWC) | $14,000–$18,000 | $3,500–$5,500 | –$10,500 to –$12,500 | –13% to –16% of typical $80K landed shipment |
| Bunker / Fuel Surcharge (BAF) | $1,200–$2,000 | $400–$700 | –$800 to –$1,300 | –1% to –1.5% |
| Origin THC & Handling | $800–$1,200 | $600–$900 | –$200 to –$300 | –0.2% to –0.4% |
| Container Equipment Imbalance Fee | $500–$1,500 | $0–$300 | –$500 to –$1,200 | –0.5% to –1.5% |
| Total Freight-Related Relief | $16,500–$22,700 | $4,500–$7,400 | –$12,000 to –$15,300 | –15% to –19% of landed value |
| Offset: Wood & Panel Inflation (2022–2026 cumulative) | Baseline | +5% to +12% | +$2,000 to +$5,400 | +2.5% to +6.5% |
| Offset: Foam & Chemical Feedstock Volatility (net elevation) | Baseline | +8% to +15% | +$3,200 to +$6,750 | +4% to +8% |
| Offset: Labor & Compliance Inflation | Baseline | +8% to +14% | +$2,400 to +$4,200 | +3% to +5% |
| Net Observable Relief on Invoice | — | — | –$1,200 to +$2,800 | –1.5% to +3.5% |
For reference only, subject to official verification.
The math is still brutal. The freight savings are real and significant, but they are structurally outweighed by cost increases in categories that do not trend downward—or that trend downward only after violent spikes. Your supplier is not wrong when they say “other costs went up.” They are wrong when they imply those increases perfectly neutralize the freight drop. The gap between those two truths is where profit gets quietly harvested. In many cases, the net observable relief on your invoice is either zero or slightly negative.
Here is where the raw material story gets more honest than the factory spreadsheet. Wood costs are not a single index. In the first half of 2026, China’s average log import price rose roughly 4.7% year-over-year, while sawn timber imports climbed about 11.5%. But North American species—black walnut, ash, white oak—actually retreated by roughly 200 RMB per cubic meter in early 2026. The factory rarely mentions that part. They show you the lumber invoice, not the species mix.
Foam chemistry is even more volatile. TDI, the core feedstock for polyurethane foam, swung wildly in 2026: from roughly $1,900 per metric ton in March, spiking to near $3,000 at peak, then sliding to approximately $2,250 by July. Polyether polyol tracked a similar rhythm. A factory locking in foam supply during the March–May window got hammered; a factory buying spot in July caught a break. Most factories smooth this volatility through quarterly contracts, but they price your sofa using the peak-month memory, not the trough. That is how a genuinely volatile input becomes a permanently elevated cost on your invoice.
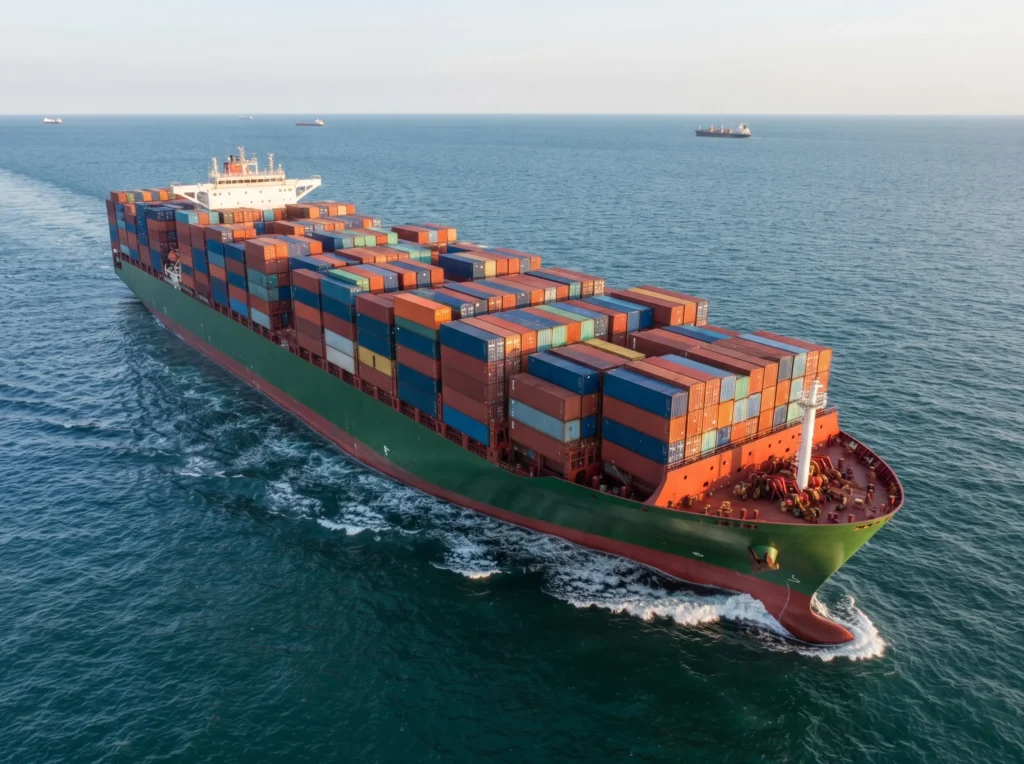
Factory Pricing Psychology: Why Sticky Pricing Persists
We have walked the factory floors in Shunde, Longjiang, and Houjie. The psychology behind sticky pricing is more nuanced than greed. It is a survival reflex baked into a low-margin industry.
| Factor | Mechanism | Typical Magnitude | Buyer Impact |
|---|---|---|---|
| Raw Material BOM Inflation | Wood, steel, foam, and fabric indices rose post-2021 and plateaued at higher levels; factories lock in annual supply contracts at elevated baselines | +10% to +18% since 2021 | Direct pass-through to FOB pricing; rarely itemized on buyer invoices |
| Labor Cost Escalation | Guangdong and Zhejiang minimum wage adjustments; aging workforce reduces supply of experienced craftspeople | +8% to +15% since 2021 | Embedded in unit price; factories cite “worker retention” as non-negotiable |
| Energy & Environmental Compliance | Stricter VOC emissions rules in Foshan; natural gas price volatility for kiln-drying and metal finishing | +5% to +10% since 2021 | Compliance cost buried in overhead allocation |
| Sticky Pricing / Margin Recapture | Factories absorbed partial freight surcharges in 2021 to remain competitive; now they recapture margin by refusing to lower base prices proportionally | Base price holds steady despite –$10K freight swing | Buyers pay 2022-level FOB for 2026-level freight |
| RMB Depreciation Windfall | USD/CNY moved from roughly 6.45 in early 2022 to approximately 7.10–7.25 in 2026, a depreciation of roughly 10%–12%. Factories invoicing in USD now convert each dollar into significantly more RMB | In theory, creates room for USD price reductions | In practice, factories treat the extra RMB as a balance-sheet recovery buffer and do not pass it through to buyers |
| Factory Profit Protection | After two years of margin compression, mid-size factories prioritize balance-sheet repair over volume growth | Base price maintained or nudged upward | Reduced willingness to offer volume discounts or extended payment terms |
For reference only, subject to official verification.
Here is what most buyers miss. During the 2021–2022 freight crisis, many factories absorbed 20% to 40% of the freight inflation to keep orders flowing, gambling that rates would normalize. When rates did normalize, they did not view it as a windfall to share. They viewed it as recovery of foregone margin. That is sticky pricing in action. It is not illegal. It is not irrational. But it is why your invoice stays high.
A factory owner in Dongguan told us: “I lost money on every container in 2021. Now shipping is cheap again, why should I give that back?” That sentiment is widespread. Cost pass-through is a one-way street in their mental model.
The RMB depreciation adds another layer of opacity. In 2022, a $100 FOB sofa at 6.45 generated 645 RMB for the factory. Today, at 7.20, that same $100 generates 720 RMB—a 11.6% revenue boost in local currency, with zero change to your invoice. In a competitive market, that depreciation should exert downward pressure on USD pricing. Instead, factories treat it as a silent subsidy for their 2021 losses. You are paying the same dollars for a currency environment that has shifted dramatically in the factory’s favor.
Supply Chain Layer Markup: Who Captures the Freight Savings
The container rate is only one line item in a multi-layered markup chain. Understanding why prices stay high requires tracing who touches the money after the vessel leaves Yantian.
| Supply Chain Layer | Pricing Method | Freight Savings Capture | Transparency Level |
|---|---|---|---|
| Furniture Factory (FOB basis) | EXW or FOB unit price; freight excluded | Captures savings via sticky base pricing and margin recapture | Low to moderate; buyers rarely see itemized cost build-up |
| Export Trading Company / Sourcing Agent | Commission (3%–8%) or markup on EXW; may bundle “logistics management” | Maintains original markup percentage on now-lower freight; absolute profit falls, but margin % stays intact | Very low; “service fees” are often opaque |
| Freight Forwarder / NVOCC | All-in rate or fee-per-container; may add origin/destination handling | Passes through lower ocean rates but preserves ancillary fee margins (documentation, customs, chassis) | Moderate; spot rates are visible, surcharges are not |
| Customs Broker / Destination Agent | Per-entry fee or hourly; drayage markup | Largely neutral; savings minimal at this layer | Moderate |
| US / EU Retailer (End Seller) | MSRP or dynamic retail pricing | Explicitly captures the widest spread; maintains 2022-era retail prices while input costs soften, expanding gross margin significantly | High internally, invisible to consumer |
For reference only, subject to official verification.
The most egregious opacity sits with the middleman. We have reviewed agent quotes where the “ocean freight” line item dropped from $12,000 to $4,200, yet the “total logistics charge” only fell from $14,500 to $7,800. The agent kept their margin percentage intact on a smaller base, then padded the difference with reclassified handling fees. Buyers without direct carrier relationships rarely catch this.
Retailers are the quiet winners. A Midwest furniture chain importing $50 million annually might see genuine landed cost relief of 5% to 7% while keeping shelf prices flat. That margin expansion is entirely legal and largely invisible. The narrative of “global supply chain instability” becomes a convenient justification for maintaining 2022 panic pricing.
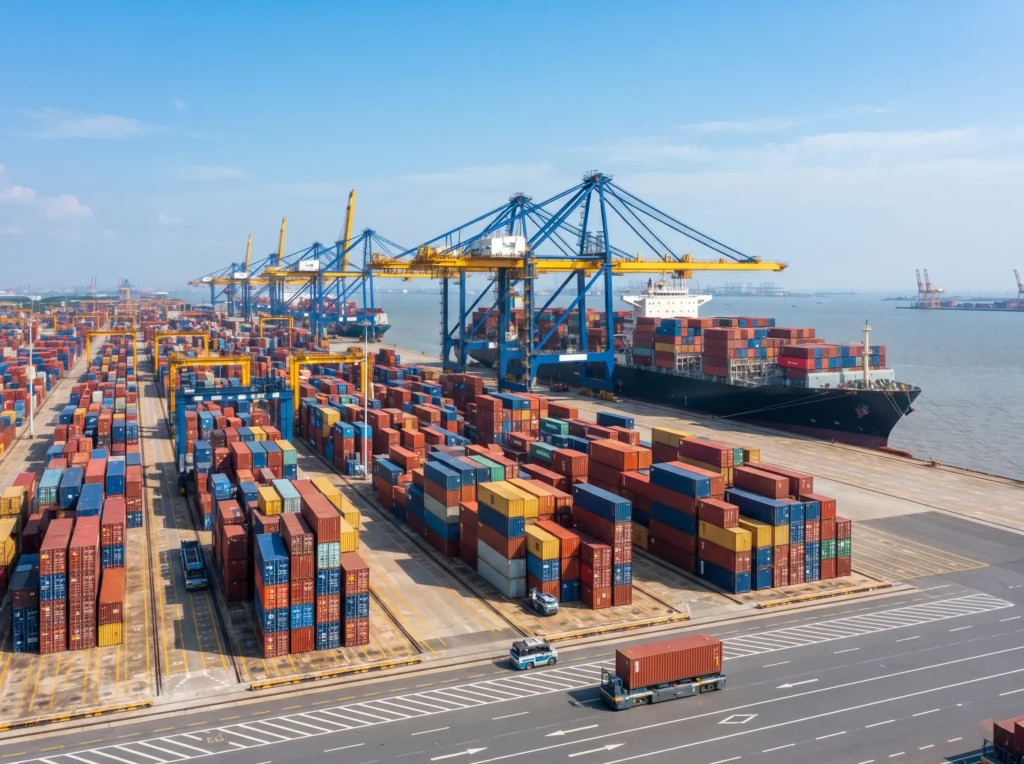
Red Flags and Hidden Traps
If you are negotiating post-freight-drop pricing, watch for these maneuvers.
The “comprehensive cost” smokescreen. Any supplier who refuses to break down FOB versus logistics versus duty is hiding something. Demand itemization. If they decline, that is your signal to audit or switch suppliers. Transparency is not a favor; it is a prerequisite for a professional relationship.
The stale freight reference. Some long-term contracts signed in 2022 contain freight escalation clauses based on outdated index peaks. A contract referencing Q3 2022 SCFI averages as a baseline is effectively a permanent surcharge. We have seen contracts where the “freight adjustment factor” still assumes $10,000+ slots despite current rates below $5,000.
The retail margin recapture trap. If you are a retailer, your own pricing power may be the real villain. Your landed cost has softened, but your shelf price remains pegged to 2022 panic levels. That is your margin expanding, not the factory’s. Regulators in the US and EU are increasingly scrutinizing such pricing behavior under inflationary profiteering frameworks.
The RMB depreciation squeeze. Factories invoice in USD but pay wages and raw material suppliers in RMB. When the RMB weakens further mid-production, they rarely lower the USD price. Instead, they pocket the conversion gain. Track the USD/CNY rate at order confirmation versus invoice date. If the rate moved from 7.10 to 7.25 between your PO and delivery, the factory is earning more RMB per dollar without passing any benefit downstream. Discrepancies here are common and costly.
The shipment consolidation bait. Some agents push you to consolidate smaller orders into shared containers, claiming freight absorption benefits. In reality, they charge you an inflated LCL-equivalent rate while paying the carrier a rock-bottom FCL price. Always ask for the original carrier invoice on consolidated moves.
Audience-Specific Playbooks
For Large-Volume B2B Importers
You have leverage. Use it. Request a detailed cost build-up for your top twenty SKUs. Benchmark raw materials against public indices like the China Timber Price Index or Chemical Fiber Price Index. If the factory claims foam costs rose 20%, verify against the TDI market. Push for FOB-plus-freight transparency rather than all-in CIF quotes. Consider direct NVOCC relationships to bypass agent markup. Lock in quarterly price reviews with explicit freight pass-through language. If a factory refuses to itemize, treat it as a red flag.
For Small Retailers and E-Commerce Sellers
Your volume is too small to dictate terms, but you can still protect margin. Consolidate shipments aggressively. A 40HQ shared among three sellers cuts per-unit freight to a fraction of LCL rates. Avoid agents who refuse to show the original carrier invoice. Use simple spreadsheet reconciliation: if the ocean line item dropped 60%, your total logistics line should drop roughly 50% after handling. If it drops 15%, you are being padded. Time inventory builds for post-Lunar New Year softness when factory labor costs temporarily dip.
For Individual Buyers and Interior Designers
You are at the bottom of the food chain, but you are not powerless. Buy from retailers who disclose country of origin and approximate landed cost structures. If a brand claims “shipping is cheaper now,” ask why the retail price has not moved. For custom orders direct from China, use a reputable freight forwarder with itemized billing rather than a black-box sourcing agent. Be skeptical of “free shipping” promotions; the freight is buried in the unit price at a 2022-era rate. Your best defense is information asymmetry reduction.

Frequently Asked Questions
Why did my supplier lower prices during the freight spike but refuse to now that rates dropped?
During the 2021–2022 crisis, many factories faced a binary choice: absorb part of the freight shock or lose the order. They chose absorption as a survival tactic, often cutting their own margin to near zero. Today, they view the recovery of that sacrificed margin as legitimate business repair, not opportunism. From their perspective, the base price was artificially low during the crisis. You see sticky pricing. They see deferred margin recapture. The asymmetry is maddening, but it is rational from their side.
How much of my furniture’s final cost is actually shipping?
For most upholstered and case goods imported from China to the US West Coast, ocean freight represents roughly 15% to 22% of total landed cost at 2026 rates. At the 2022 peak, it briefly touched 25% to 30% for lower-value goods. It is a major component, but raw materials, labor, and tariffs still collectively dominate your invoice. This is precisely why freight volatility alone cannot drive proportional price swings—especially when other cost buckets are expanding simultaneously.
Are suppliers lying when they say raw material costs offset the freight decline?
Partially. Material cost movements since 2021 are real but highly differentiated. Wood costs are mixed—some species up, some down. Chemical feedstocks like TDI have been violently volatile, not steadily inflated. A factory claiming that material hikes completely erased a $10,000 freight saving is likely blending genuine cost increases with profit protection and selective index cherry-picking. Demand specifics. Ask for the BOM cost build-up by material category. If they cannot produce it, the claim is suspect.
Can I renegotiate a long-term contract signed during the freight peak?
Yes, but approach it surgically. Do not demand a blanket 30% reduction. That invites immediate rejection. Instead, request a contract amendment that decouples freight from product cost. Move to an FOB factory pricing model with freight handled separately. If the supplier insists on all-in pricing, demand that the freight component be indexed to a published rate like SCFI or Freightos Baltic Index with quarterly true-ups. Make the math transparent, not emotional.
Is it better to switch from CIF to FOB terms now that shipping is cheaper?
Generally, yes. FOB terms give you direct control over carrier selection, routing, and freight auditing. When rates were volatile, CIF offered convenience. In a soft freight market, CIF is often a vehicle for hidden markup. The factory or agent selects the cheapest slot while charging you a blended rate that assumes 2022 pricing. FOB restores visibility. The administrative burden is slightly higher, but the savings and control are worth it for any buyer moving more than a few containers annually.

What Is Your Freight Story?
We have laid out the mechanics. Now we want to hear from the floor. Did you successfully negotiate a post-freight-drop price cut, or did your supplier stonewall you with the “other costs went up” defense? Are you seeing hidden markup games from your logistics agent? Have you caught a retailer maintaining 2022 prices while their import costs softened? Drop your experience in the comments or send us a direct question about your specific landed cost scenario. We read every message, and we use them to sharpen our next investigation.
Recommended Resource
Interi Furniture specializes in custom furniture manufacturing for residential, hospitality, and commercial projects. Their experience in materials, craftsmanship, and project realization makes them a valuable resource for designers and buyers seeking tailored furniture solutions from China.